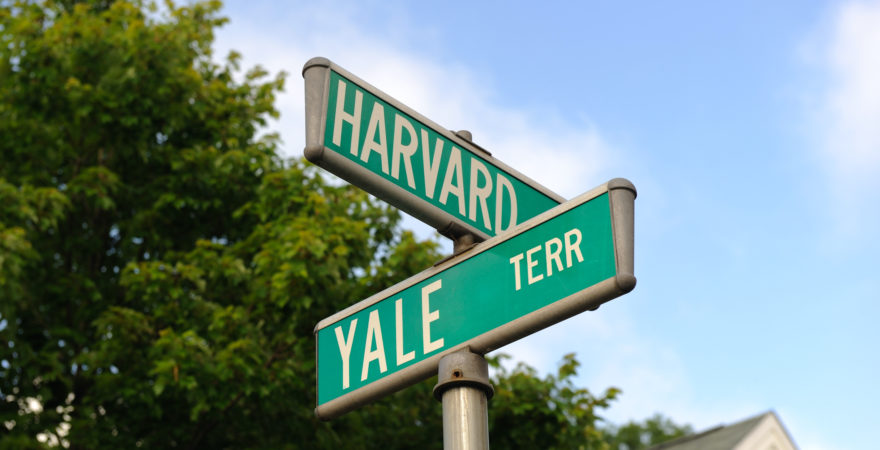
Sure, it’s hard to get into Harvard, you may have thought recently. It’s one of the top five universities in the world. (It’s actually ranked sixth, but who’s counting?) But what does “hard to get into” really mean? I’m a strong high school student with a good resume. Don’t I have good grades in hard classes and excellent SAT scores? Don’t I play a sport and an instrument and have interesting hobbies? What about my service trip, summer program, after school job? What more could top colleges want?
If that’s you, don’t get us wrong – you sound like a fantastic student and person. And you’ve probably heard people who went to Ivy League schools and other top universities say, “Oh, I couldn’t get in there now!” To some degree, it’s easy to see what they mean. Twenty years ago, the average acceptance rate at top universities was around 20-25%. Today, last year’s admission rates were closer to 5%. Don’t those record low acceptance rates mean that it’s much harder to get into these elite universities now than it was ten, twenty, thirty years ago?
In some ways, yes. Harvard, Yale, Princeton, Brown, Cornell, Stanford, MIT, Dartmouth, UPenn, Columbia, and the rest – their class sizes haven’t grown very much, if at all, and yet they receive thousands upon thousands more applications for the same number of spots. As a result, their admission rates have plummeted, some by twenty percentage points or more.
On the other hand, the admission rate is a bit of a red herring. Yes, the number of applications has risen dramatically. But does that really mean it’s harder to get in?
It is a fact that the admission rates at Ivy League and other elite universities had dropped significantly in recent years—some steadily, some quite dramatically:
| School | Admission Rate by Year* | |||||
| 2019 | 2018 | 2015 | 2010 | 2000 | 1990 | |
| Stanford University | 4.0% | 4.3% | 7.1% | 10.8% | 15.9% | 19.3% |
| Harvard University | 4.5% | 4.6% | 6.2% | 9.3% | 10.9% | 14.3% |
| Columbia University | 5.1% | 5.5% | 6.4% | 11.4% | 14.8% | 32.3% |
| Princeton University | 5.8% | 5.5% | 8.3% | 10.2% | 12.2% | 16.9% |
| Yale University | 5.9% | 6.3% | 7.4% | 7.9% | 16.2% | 19.7% |
| University of Chicago | 5.9% | 7.3% | 14.0% | 18.4% | 38.5% | 45.0% |
| Massachusetts Institute of Technology | 6.6% | 6.7% | 7.8% | 11.8% | 14.3% | 22.0% |
| Brown University | 6.6% | 7.0% | 8.7% | 9.3% | 16.2% | ** |
| University of Pennsylvania | 7.4% | 8.4% | 12.3% | 17.7% | 22.8% | 47.0% |
| Duke University | 7.4% | 8.6% | 9.4% | 18.9% | 25.4% | ** |
| Dartmouth College | 7.9% | 8.7% | 9.7% | 15.7% | 20.8% | 26.0% |
| Cornell University | 10.6% | 10.3% | 17.8% | 24.7% | 30.9% | 27.9% |
*Data sourced from university websites and news articles. Some data is not available in any reliable form; those years are marked with asterisks (**) in the table.
Obviously, there is some surprising information in these admissions statistics! The admissions rate has clearly declined precipitously at all these schools over the past twenty years, from an average of about 27% to last year’s average of approximately 6.5%. As you can see, some schools’ freshman admission rates have declined more dramatically than others. While Harvard and Yale’s rates have ticked down steadily since 1990, but from relatively low starting points, other very selective schools, like the University of Pennsylvania, Cornell, and Columbia, have all witnessed extremely steep declines in the 1990s and 2000s. That’s because all of these schools have worked steadily over the past four decades to get as many applications as possible. The more students apply, the more they can reject, and the more selective they seem.
So, what happened?
You’ve probably heard some simple explanations for the rise in applications. More students than ever are choosing to attend college after high school rather than attend a trade school, associate’s degree program, or go straight into the workforce. Or you’ve heard the population is growing, both through birth rates and immigration, meaning there’s just more kids out there. And maybe you’ve heard it’s all about international students’ applications.
There is some truth to the above narratives. Overall, the number of applicants, including first-generation students, has indeed risen over the past three decades. However, the number of high school students actually peaked in 2011, and, while universities are not growing as fast as their applicant pools, many of them are adding seats to their classes.
Rather, to explain changes in admissions statistics over the past ten to fifteen years, remember this: those enormous numbers in the denominators of those percentages are not applicants, but applications.
That is, a rise in the number of discrete students cannot fully explain the decline in acceptance rates at selective colleges in recent years. Rather, technological changes like the rise of the online Common Application, university initiatives to encourage more applications, and the attending cultural shift of normalizing ten, fifteen, even twenty applications per student, had caused an enormous rise in the number of applications and thus a steep decline in admission rates.
The globalization of applying to college has magnified this trend. Not only are American high schoolers applying to more schools, they’re applying all over the country. And it’s not just them; students from all over the world can apply to American universities through the convenience of the internet, which again drives up the number of applications. International student applications have grown substantially over the past twenty years, meaning that just looking at American demographics is a poor way to understand the college admissions landscape.
Lastly, the growing importance of early decision—pioneered by the University of Pennsylvania and others in the 1980s—to universities seeking to maximize their yields has also driven down admissions rates dramatically. You can read more about early decision [here], but it’s important to keep in mind that when you see an “overall admission rate” statistic (including the ones in this post), it’s an aggregate number that includes both early decision applicants and regular decision applicants. However, the admission rates for early action and early decision applicants is nearly always higher, which means the admit rate for regular decision applicants at places like Penn, Brown, Columbia, and Cornell is actually lower than the stated figure.
All of which raises an important question. Are selective schools evaluating candidates differently than they were before? Or are they just looking for the same needles in a much bigger haystack?
Here’s the good news: elite universities are still looking for the things they’ve always liked. They like excellent grades. They like students who take initiative, serve their communities, do well on the SAT or ACT, and are passionate about learning. In some significant ways, the Ivy League admissions process is the same as it always was. The bad news is, it’s easy to get lost in the ever-growing pile of applications. Even if you are what they’re looking for, you should know how schools have changed the college admissions process to make sense of their thousands of entries.
First, you probably know that some particularly talented high school athletes can take a different road into top colleges than others. Coaches at colleges and universities have some say in the college admissions process (known as “recruiting”), so some student athletes are admitted on a coach’s recommendation, even if their profile might not have gotten the attention of admissions as an ordinary applicant. Top colleges do have minimum GPA and SAT/ACT score standards for their recruited athletes, but they tend to be lower than what students need in the regular pool. Recruited athletes are also likely to commit to a school over the summer, meaning they count as early applicants, another thing to keep in mind when looking at those early numbers.
Second, you may have heard about something called the Dean’s Interest List, a feature of the admissions process at Harvard that emerged during the recent lawsuit against them, and has been revealed to be a feature of the college admissions process at other top schools, too. These highly secretive lists refer to applicants who have been marked by the Admissions Office as being “of interest to the school” for one reason or another. These applicants might be athletes, legacies, children of major donors, or otherwise have a connection to the university and its faculty or administration. The admission rate for students who can get a spot on these coveted lists is significantly higher than that for either early or regular decision applicants. Not all schools consider legacy status when evaluating a prospective applicant, so it’s important to know which schools take legacy status into consideration.
Finally, there’s a (mis)perception that elite schools admit a large number of students from minority racial backgrounds and lower socioeconomic standing, perhaps “instead of” students with higher grades and test scores. While it is true that most selective schools treat applications from disadvantaged high school students holistically—as they do all applications—to understand how sociological barriers may have impacted students’ academic profiles, the overall data show that universities like Yale and Harvard still admit a disproportionate number of white students from affluent backgrounds, compared to the demographic average of the nation.
At the end of the day, the question for you is: how do you stand out in this crowd? We’re here to help. Check out our other pages to learn more about how teaming up with a college admissions consultant can help you beat the odds and gain admission to the school of your dreams.


Contact us to learn more about our admissions consulting services.